I’ve aways been in awe of the IronViz competitors for their level of skill and sense of style. I always wanted to submit and entry to a feeder contest, but always felt like my skills were lacking because since 2011 I’ve only done “corporate” work and never pushed the art and creative side.
Since really committing to #MakeOverMonday and doing a lot of “side vizzing” I’ve been pushing myself and personally feel like I’ve made great strides in the last 8 months. So when Tableau posted the Safari IronViz Feeder contest I decided to throw my hat in the ring.
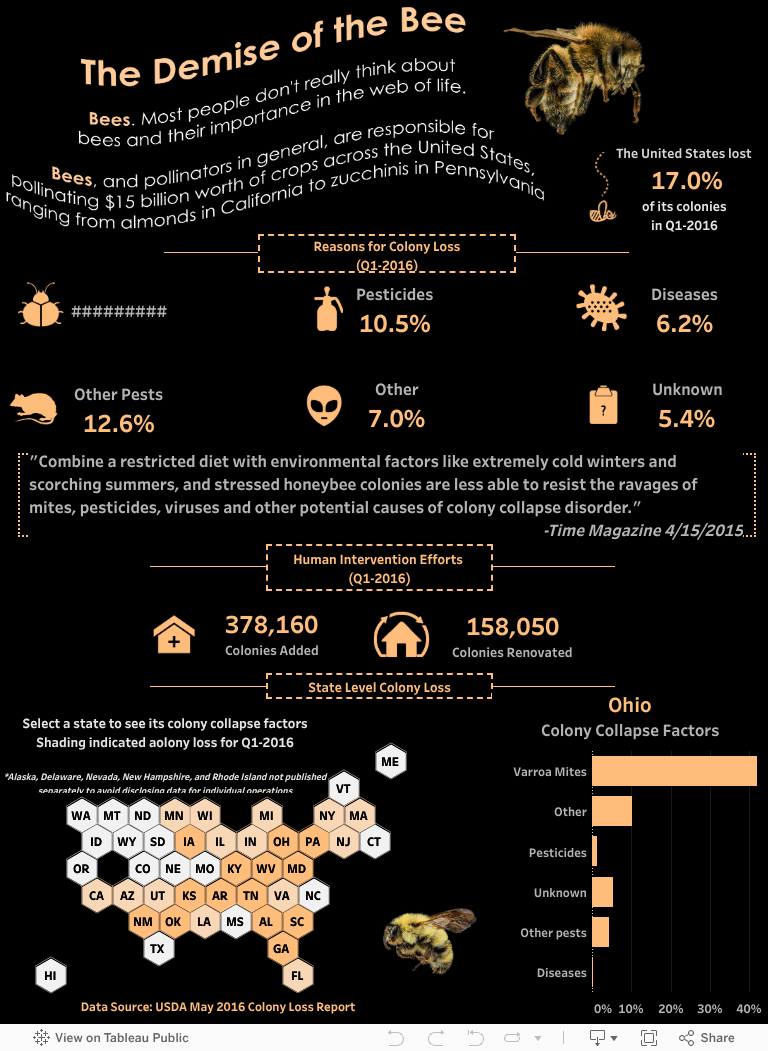
First challenge; find a data set! I had no idea what I wanted to do, so I just started googling for animal data sets and I wasn’t super enthralled with anything I was finding. Then I remembered that my wife had recently attended a local naturalist’s presentation on bees, so I started googling for bee data and came across the USDA Colony Loss reports, but they were in PDF format.
The 10.3 Blessing – The PDF Connector
With the release of 10.3, the data world became a little wider with the ability to connect to PDFs, and this was a great chance to put the connector through its paces.
It worked beautifully, giving me lots of options on the tables that were contained in the PDF documents. After the initial connection and playing with the data a bit I ended up extracting from Tableau to Excel to do some further manipulation.
Iteration, Iteration, Iteration
So I had my data, and I sketched out on paper what I wanted to do. I started to build my initial draft and it was coming together nicely. Then I decided that I needed to gather some feedback, since this was my first jump in the IronViz pool… I knew it needed “more”
I posted a message on Twitter asking if anyone wanted to act as my “coach” and 4 wonderful people from the UK chimed in and suggested doing a group direct message to toss around ideas. I had my “bee hive” for ideation.
Huge thanks to Dave Kirk (@daveedkirk) Rebecca Roland (@RebeccaJRoland) Sarah Bartlett (@sarahlovesdata) Lorna Eden (@lorna_eden) as they were quick to respond and had great ideas on how to improve on my ideas and make my overall messaging better. The whole experience was amazing and I am forever grateful for the iterative thinking that went in to the three or four days of discussion.
Once I let the dust settle on the bee hive of activity, I reached out to Pooja Gandhi (@DrexelPooja) of the Data Duo, as she is a huge inspiration to me with her style and creativity. She had a couple of great suggestions that cleaned up what I had quite a bit.
Then I reached out again to Ken Flerlage (@flerlagekr) for one last opinion and suggestion. Ken’s IronViz entry is killer, as is the rest of his portfolio. Ken has some great feedback as well.
The Honeycomb!
One of my favorite elements of the visualization is the honeycomb map. There are a few states that didn’t report, so I excluded them from the honeycomb which makes it look more natural. The end result I thought was very cool, and added the bee flying toward the honeycomb solidified the idea.
Icons! NounProject.com
The icons were a suggestion from the Bee Hive, and I loved the idea. The icons came from the NounProject, and I edited them in GIMP to color them to match the highlight/emphasis text.
Pooh-esqe Words… PowerPoint Magic
Driven by a self-professed cake overload, Dave Kirk suggested that would be cool if the words snaked around like in a Winnie the Pooh book.
Pooja turned me on to the magic of PowerPoint image editing, so I decided to try and curve the words in PowerPoint to give it some movement and flow. The result was the header of the dashboard and it turned out wonderful.